
Angular Performance
In this series of challenges about performance, you will learn how to optimize and enhance the performance of your Angular application.
Before starting to resolve any challenge, I invite you to download the Angular DevTools Chrome extension if you haven't already done so.
This extension allows you to profile your application and detect performance issues, which is very useful for understanding where performance issues can occur.
How to use it
When you serve an Angular application, you can inspect a page by pressing F12, which will open the Chrome developer tools. Then navigate to the Angular tab. From there, you can select the Profiler tab as shown below.
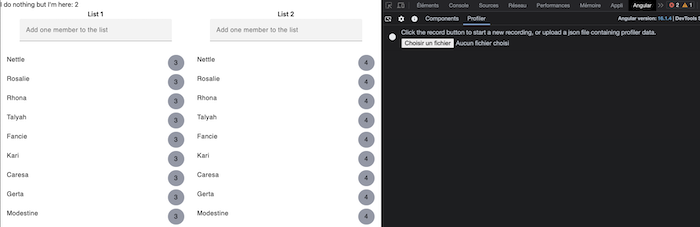
You can now profile your application by clicking on the record button. You can play with your application and see when change detection is triggered and which components are rerendered.
Now that you know how to use the Angular DevTool, you can choose a challenge, profile it, and resolve it.🟢 Default vs OnPushLearn the difference between Default and OnPush change detection strategies.
🟢 MemoizationLearn the power of pure pipes.
🟢 NgFor OptimizationLearn how to improve looping performance.
🟠 Optimize Change DetectionLearn how to remove zone pollution.